Transactions (Analyzer)
The Transactions panel displays 5 sections: Payments Received, Kiosk Sales, Code Sales, Products Sold, and Account Sales. This panel allows a quick snapshot of wash transactions for the selected time frame. This panel is also exportable to PDF or Excel.
Tools
Date Range
The Date Selector provides the ability to specify the time frame for which to view payments data:
- Today
- Yesterday
- This Week
- Last Week
- This Month
- Last Month
Calendar Selector
The Calendar Selector provides the ability, in addition to the Date Selector options, to specify the date for which to view payments data.
Export to PDF
The Export to PDF function generates and downloads a PDF file that contains the current Payments Report data.
Export to Excel
The Export to Excel function generates and downloads an XLSX file that contains the current Payments Report data.
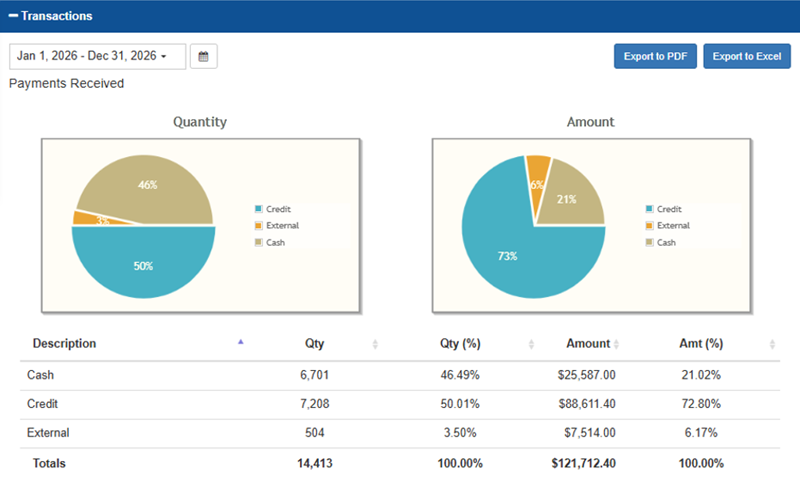
Payments Received
The Payments Received section provides quantity and amount metrics for payments received, organized by credit payments and external payments. External payments are payments received from codes that are issued through the register and pump sales.
Important: X-Start and C-Start kiosk terminals do not accept cash, so this line item is not present for sites that use those terminals.
Quantity Pie Chart
The Quantity pie chart provides the percentage of the number, of all payments received, that each payment type (credit or external) comprises.
- Example: If 10 payments were received, and 7 were credit and 3 were external, credit would be 70% and external would be 30%.
Cash
The percentage of the number of payments received that were received via cash payment.
Important: X-Start and C-Start kiosk terminals do not accept cash, so this line item is not present for sites that use those terminals.
Credit
The percentage of the number of all payments received that were received via credit payment.
External
The percentage of the number of all payments received that were received via external payment.
Amount Pie Chart
The Amount pie chart provides the percentage of the amount, of all payments received, that each payment type (credit or external) comprises.
- Example: If $100 total payment was received, and $20 was received via credit and $80 was received via external, credit would be 20% and external would be 80%.
Credit
The percentage of the total amount of all payments received that were received via credit payment.
External
The percentage of the total amount of all payments received that were received via external payment.
Payments Received Table
The Payments Received table provides the number of credit payments, number of external payments, the percentage of payments that were credit, the percentage of payments that were external payments, the total value received from credit payments, the total value received from external payments, the percentage of payments received that were credit, and the percentage of payments that were external.
Description
The Description column provides the type of each payment: Credit and External.
Qty
The Qty column provides the number of credit payments and the number of external payments.
Qty (%)
The Qty (%) column provides the percentage of payments that were credit and the percentage of payments that were external payments
Amount
The Amount column provides the total value received from credit payments and the total value received from external payments.
Amount (%)
The Amount (%) column provides the percentage of payments received that were credit and the percentage of payments that were external.
Kiosk Sales
The Kiosk Sales section shows kiosk sales by wash packages, cash, and credit transactions.
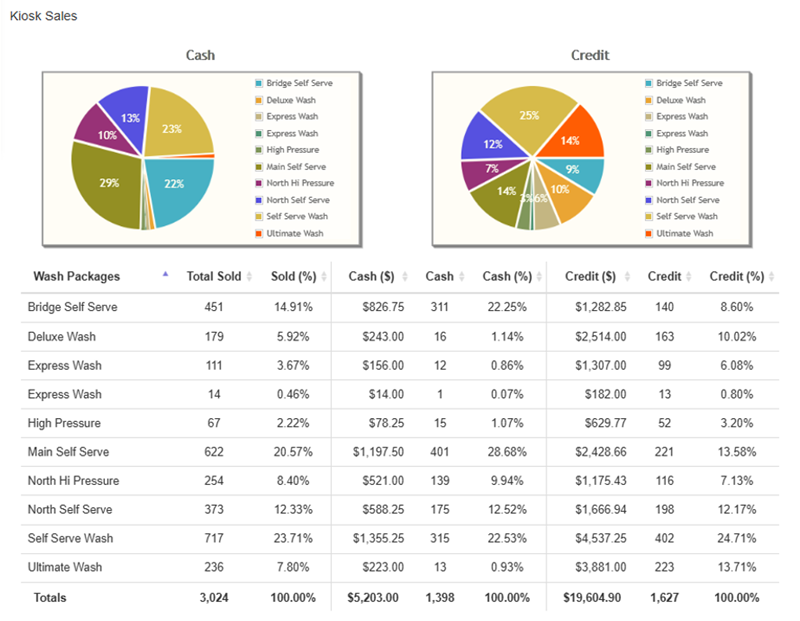
Cash Pie Chart
The Cash pie chart provides the percentage of each wash package tendered to cash at a kiosk terminal, compared to all wash packages that were tendered to cash.
Credit Pie Chart
The Credit pie chart provides the percentage of each wash package tendered to a payment card at a kiosk terminal, compared to all wash packages that were tendered to a payment card.
Wash Packages Table
The wash packages table provides cash and payment card tendering data for each wash package sold at a kiosk terminal.
Wash Packages
The Wash Packages column provides the name of each wash package that was sold from a kiosk terminal for the generated report.
Total Sold
The Total Sold column provides the number of sales from a kiosk terminal for the corresponding wash package.
Sold (%)
The Sold (%) column provides the percentage of all sales from a kiosk terminal that the corresponding wash package represented.
Cash ($)
The Cash ($) column provides the sum of cash collected from a kiosk terminal to tender a sale for the corresponding wash package.
Cash
The Cash column provides the number of sales from a kiosk terminal tendered using cash.
Cash (%)
The Cash (%) column provides the percentage of all sales from a kiosk terminal for the corresponding wash package that were tendered using cash.
Credit ($)
The Credit ($) column provides the sum of revenue collected via payment card from a kiosk terminal for the corresponding wash package.
Credit
The Credit column provides the number of sales from a kiosk terminal tendered using payment card.
Credit (%)
The Credit (%) column provides the percentage of all sales from a kiosk terminal for the corresponding wash package that were tendered using a payment card.
Totals (Bottom Row)
The Totals row, located at the bottom of the kiosk sales table, provides totals for each column.
- Total Sold: The total number of all wash packages sold at a kiosk terminal.
- Sold (%): This should be 100%, unless no sales were recorded; in which case, it will be 0.00%.
- Cash ($): The total dollar amount received from all wash packages sold at a kiosk terminal that were tendered by cash.
- Cash: The total number of wash packages sold at a kiosk terminal that were tendered by cash.
- Cash (%): This should be 100%, unless no sales were tendered to cash; in which case, it will be 0.00%.
- Credit ($): The total dollar amount received from all wash packages sold at a kiosk terminal that were tendered by payment card.
- Credit: The total number of wash packages sold at a kiosk terminal that were tendered by payment card.
- Credit (%): This should be 100%, unless no sales were tendered to payment card; in which case, it will be 0.00%.
Code Sales
The Code Sales section provides code sales transaction information grouped by the point-of-sale location where the codes were sold: at a fuel pump, at a sales terminal inside the store, or at a console (c-WashPal terminal). A pie chart and table are provided for each location.
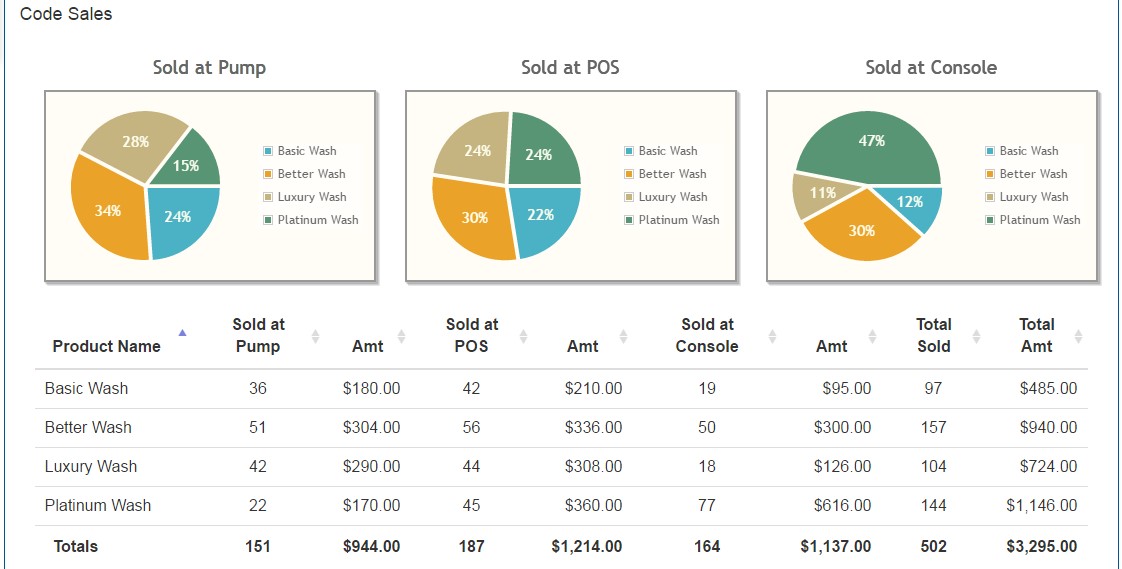
Sold at Pump
The Sold at Pump pie chart and table provide the percentage of all codes sold at fuel pumps for each wash code, the number of each wash code sold at fuel pumps, and the total dollar amount of each wash code sold at fuel pumps.
Important: Pump sales can only be reported separately for point-of-sale systems support 8 PLU keys. Pump sales can't be reported separately for systems that only support 4 wash PLU keys. Systems that only support 4 PLU keys can only report pump sales in Sold at POS data. Consequently, the Sold at Pump data normally reports No data available.
![]()
Pie Chart
The Sold at Pump pie chart provides the percentage, of all wash codes sold at fuel pumps, that each wash code type (e.g., Good Wash, Better Wash, Best Wash) comprises.
Table
The Sold at Pump table provides the quantity and total dollar amount of each wash code type sold at fuel pumps.
Sold at POS
The Sold at POS pie chart and table provide the percentage of all codes sold at the store point-of-sale system for each wash code, the number of each wash code sold at the store point-of-sale system, and the total dollar amount of each wash code sold at the store point-of-sale system.
Important: The Sold at POS data normally includes both store and pump sales (for sites that sell codes at the pump, but are limited to 4 PLU keys), combined.
Pie Chart
The Sold at POS pie chart provides the percentage, of all wash codes sold at the store point-of-sale system, that each wash code type (e.g., Good Wash, Better Wash, Best Wash) comprises.
Table
The Sold at POS table provides the quantity and total dollar amount of each wash code type sold at the store point-of-sale system.
Sold at Console
The Sold at Console pie chart and table provide the percentage of all codes sold at the c-WashPal (a touch screen, panel PC that provides compact, local access to the Sales screens of the Sierra management software as a point-of-sale terminal inside a site's convenience store or office) for each wash code, the number of each wash code sold at the console point-of-sale system, and the total dollar amount of each wash code sold at the console point-of-sale.
Pie Chart
The Sold at Console pie chart provides the percentage, of all wash codes sold at the console point-of-sale, that each wash code type (e.g., Good Wash, Better Wash, Best Wash) comprises.
Table
The Sold at Console table provides the quantity and total dollar amount of each wash code type sold at the console point-of-sale.
Products Sold
The Products Sold section provides quantity and amount product transaction information, in pie chart and tabular format.
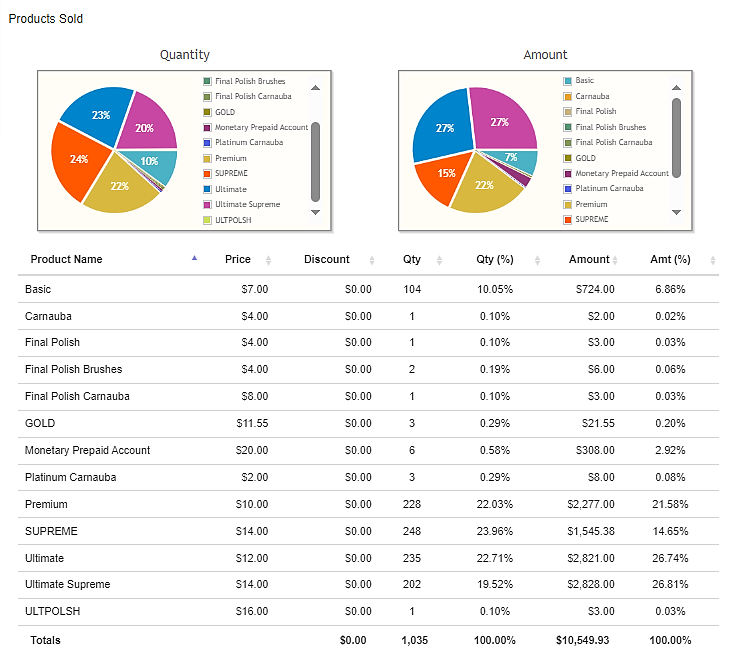
Quantity Pie Chart
The Quantity pie chart provides the percentage of the number, of all products sold, that each product comprises.
Amount Pie Chart
The Amount pie chart provides the percentage of the amount, of all products sold, that each product comprises.
Products Sold Table
The Products Sold table provides the following information for each product that was sold: price, discount, quantity, quantity percentage, amount, and amount percentage.
Product Name
The Product Name column provides the name of the product or wash package sold (for example, Good, Better, Best). Each row’s data corresponds to its product.
Price
The Price column provides the unit retail price charged for one instance of the product, shown in currency (price per unit).
Discount
The Discount column provides the total discount amount applied to that product during the reporting period, shown in currency. This reflects promotions or adjustments applied across all units of the product.
Qty
The Qty column provides the number of units of the product sold during the reporting period (absolute count).
Qty (%)
The Qty (%) column provides the product’s proportion of total units sold, shown as a percentage (product Qty ÷ total Qty × 100).
Amount
The Amount column provides the total sales amount for the product during the reporting period, shown in currency. This is the aggregate revenue for that product (typically price × Qty, adjusted for any discounts shown).
Amt (%)
The Amt (%) column provides the product’s share of total revenue, expressed as a percentage (product Amount ÷ total Amount × 100).
Totals Row
The bottom row aggregates the report: summed Qty, summed Amount, and the overall 100% values for Qty (%) and Amt (%), giving the full-period totals for the table.
Account Sales
The Account Sales section provides quantity and monetary amounts for account sales.
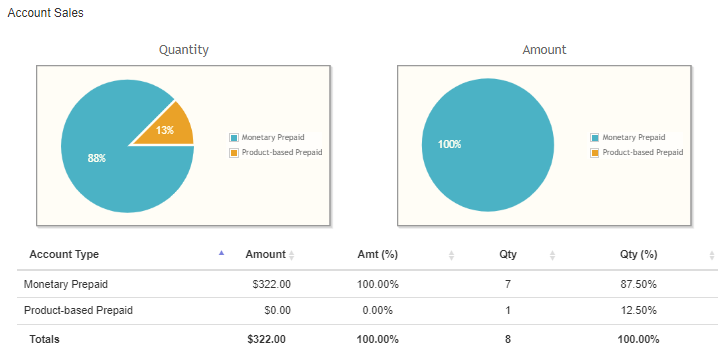
Quantity Pie Chart
The Quantity pie chart provides the percentage of the number of monetary prepaid account sales and the percentage of the number of product-based prepaid account sales.
Amount Pie Chart
The Amount pie chart provides the percentage of total revenue from monetary prepaid account sales and the total revenue from percentage of product-based prepaid account sales.
Account Sales Table
The Quantity table provides amount and quantity data for prepaid account sales and the dollar amount for product-based prepaid account sales.
Account Type
The Account Type column provides the names of the account sales categories: Monetary Prepaid and Product-based Prepaid.
Amount
The Amount column provides the dollar amount received from account sales for each account type.
Amt (%)
The Amt (%) column provides the percentage that each account type represents.
Qty
The Qty column provides the number of sales for each account type.
Qty (%)
The Qty (%) column provides the percentage that each account type represents.
Totals
The Totals row provides the sum of each column.
- Amount: The sum of monetary prepaid account sales and product-based prepaid account sales.
- Amt (%): This is 100%, unless the report has no account sales.
- Qty: The sum of the number of monetary prepaid account sales and the number of product-based prepaid account sales.
- Qty (%): This is 100%, unless the report has no account sales.