Trending (Analyzer)
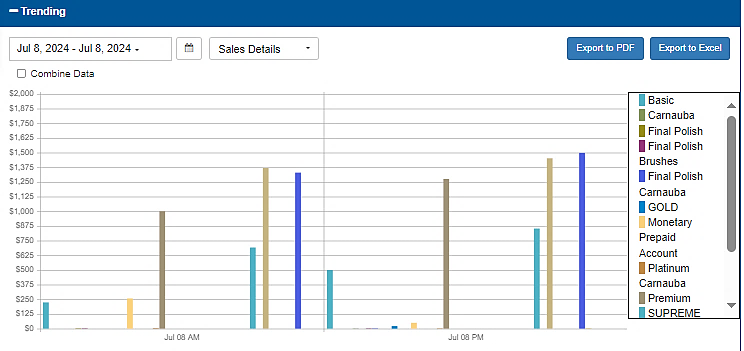
The Trending panel provides trending sales data, over a time range. The date or time below the bar graph can be selected to drill down by hour and by minute for comparison. A cursor may also be placed over the bars on the graph to open additional sales information by wash type and total sales. This panel is also exportable to PDF or Excel.
There are 4 options.
- Sales Details
- Cars Washed
- Added Services
- Time Based Products
Date Selector
The Date Selector provides the ability to specify the time frame for which to view Trending data: There are 12 options.
- Today
- Yesterday
- This Week
- Last Week
- This Month
- Last Month
- Quarterly
- Last Quarterly
- Half Year
- Last Half Year
- This Year
- Last Year
Calendar Selector
The Calendar Selector provides the ability, in addition to the Date Selector options, to specify the date for which to view Activations data.
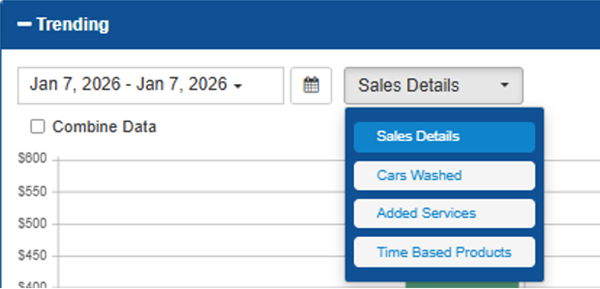
Sales Data
The Sales Data provides the ability to select the information to display. There are 4 options.
- Sales Details
- Cars Washed
- Added Services
- Time Based Products
Sales Details
The Sales Details trending data provides revenue for all products.
Cars Washed
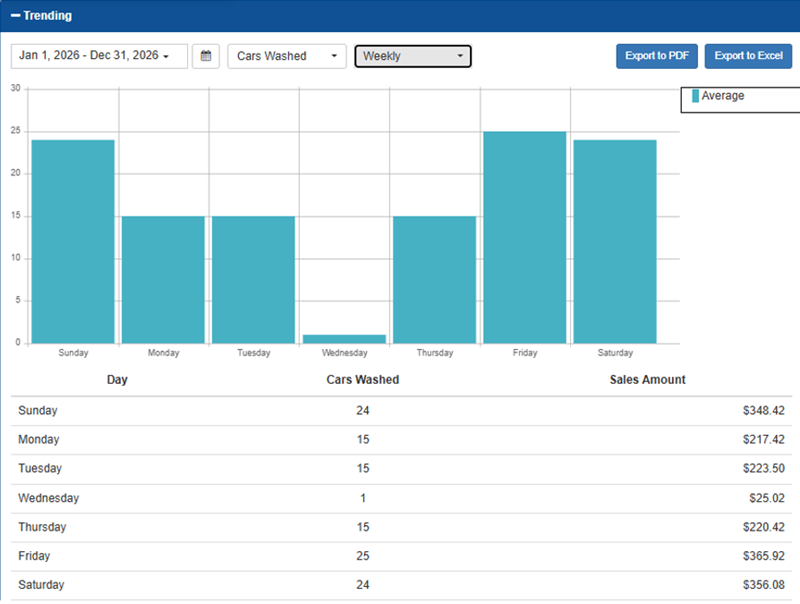
The Cars Washed trending data provides the number of vehicles washed. It includes a time parameter: daily, trending, and weekly.
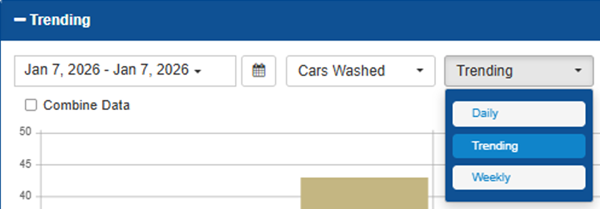
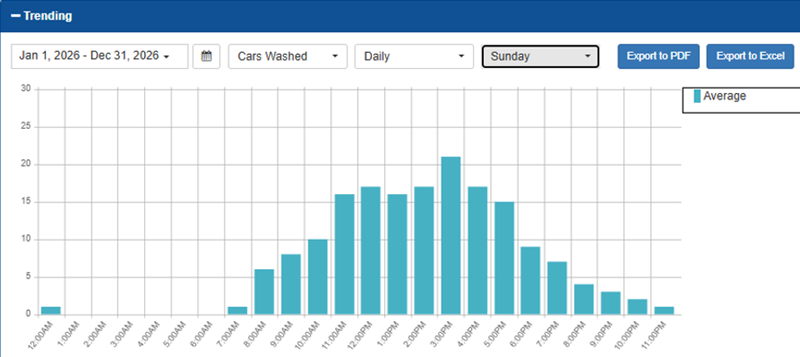
Daily
The Daily parameter for the Cars Washed metric provides the hourly averages for the selected day, for the selected time period. For example, selecting Sunday provides the hourly averages for each Sunday in the selected time period. Each day of the week can be selected.
Trending
The Trending parameter for the Cars Washed metric provides the averages for the selected time period.
Weekly
The Weekly parameter for the Cars Washed metric provides the daily averages for each day of the week (Sunday, Monday, Tuesday, Wednesday, Thursday, Friday, and Saturday), for the selected time period. This information can be helpful with identifying a specific day or days to run a special.
Added Services
The Added Services sort method provides revenue for extra service products.
Time-Based Products
The Time-Based Products sort method provides revenue for time-based products.
Combine Data
The Combine Data option provides the ability to combine all product data to display.
Export to PDF
Select the Export to PDF function to generate and download a PDF file that contains the currently selected Trending data.
Export to Excel
Select the Export to Excel function to generate and download an XLSX file that contains the currently selected Trending data.
Bar Graph
The bar graph provides sales information for the selected product type over time.
Revenue Data
The left side of the graph measures dollar amounts.
Date/Time
The bottom side of the graph measures time by date/time (day/hour/minute)
Product Key
The Product Key lists all products and provides a color code for each that corresponding to a bar on the graph.