Watcher Report (Reporter)
The Watcher Report is provided in two formats, a detailed format (Watch Details Report) and a summarized format (Watcher Summary Report). Information about both are provided below.
Important: This report can be automatically generated and sent to email recipients in the Scheduled Tasks (Tools) panel.
Watcher Summary Report
The Watcher Summary Report provides the following information, organized by site (individual sites can be expanded to reveal summary details): wash/account, total sales, sales %, quantity sold, quantity sold percent, average sale amount, and total cars washed.
Note: Counts from point-of-sale system terminals are not included in Total Cars Washed. Instead, counts for those activations are reported in the wash package count at the kiosk terminal (X-Start, C-Start, Portal, Sentinel, and Wash Select II) because they're recorded when the code is entered at the kiosk terminal (the kiosk terminal reports the count activated (washed) for the corresponding wash product).
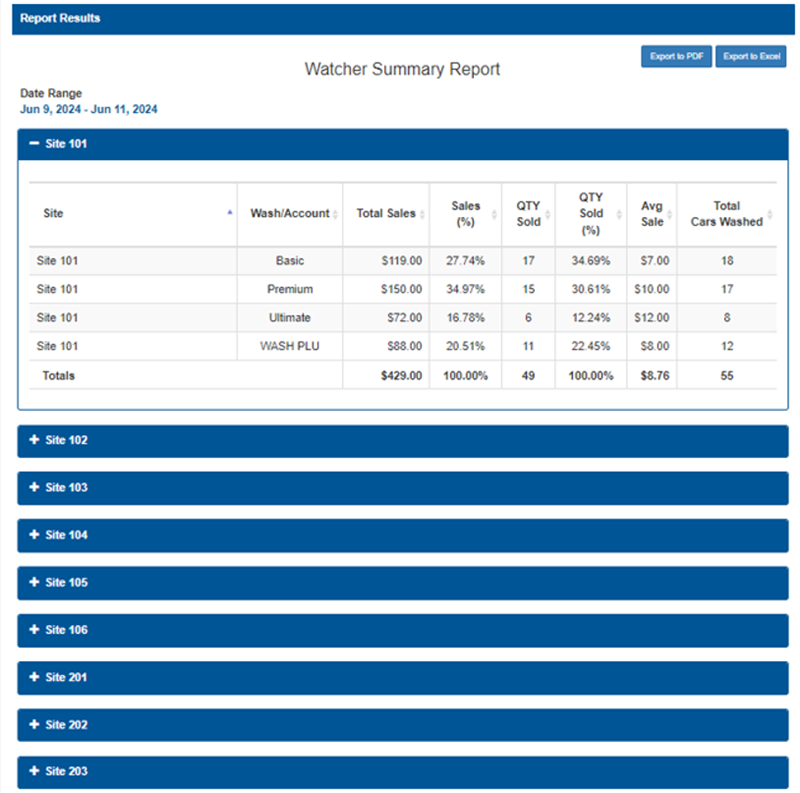
Site
The Site column provides the location for the summarized data (for example, "Site 101"). In the Watcher Summary Report, rows are grouped by site and each table section shows summaries for that site over the selected date range.
Device
The Device column provides the terminal for the summarized data.
Wash/Account
The Wash/Account column provides the wash package name or account type for the row (for example, Good, Better, Best). Each entry represents the summarized activity for that specific wash or account at the site.
Total Sales
The Total Sales column provides the aggregate dollar value of sales for the listed wash/account at the site over the report's date range (currency sum of all transactions for that row).
Sales (%)
The Sales (%) column provides the row’s share of the site's total sales expressed as a percentage (row Total Sales ÷ site Total Sales × 100), used to show each wash/account’s contribution to site revenue.
QTY Sold
The QTY Sold column provides the total number of units or transactions sold/activated for the wash/account at the site during the selected date range (absolute count).
QTY Sold (%)
The QTY Sold (%) column provides the row’s proportion of the site's total units sold, expressed as a percentage (row QTY Sold ÷ site total QTY Sold × 100), useful for comparing volume contribution.
Avg Sale
The Avg Sale column provides the average sale amount per transaction for that wash/account (typically calculated as Total Sales ÷ QTY Sold). Displayed in currency and indicates typical revenue per activation.
Total Cars Washed
The Total Cars Washed column provides the total number of vehicles washed under that wash/account for the site during the date range. This may match QTY Sold when one activation equals one vehicle, or differ if tracked separately.
Totals (Bottom Row)
The Totals row, located at the bottom of each site section, aggregates the listed rows: summed Total Sales (site total), Sales (%) = 100.00%, summed QTY Sold, QTY Sold (%) = 100.00%, site-level Avg Sale, and summed Total Cars Washed for the site.
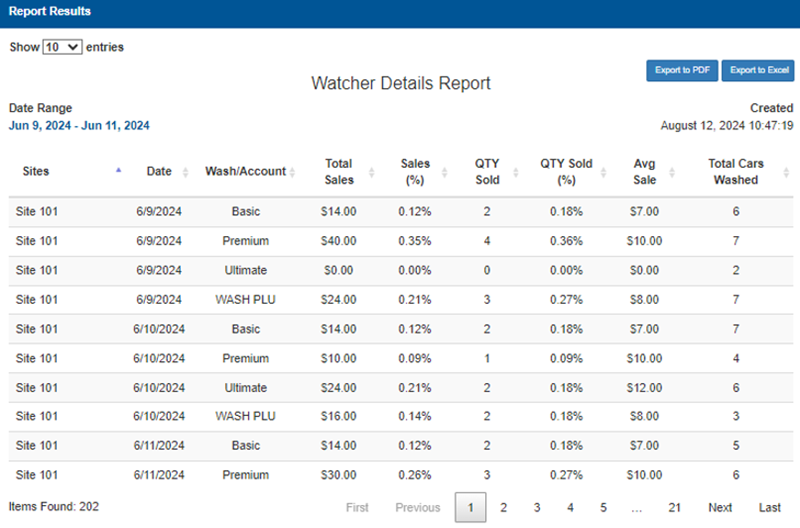
Watcher Details Report
The Watcher Details Report provides the following information for each wash/account by date: total total sales amount, sales percentage, quantity sold, quantity sold percentage, average sale amount, and total cars washed.
Sites
The Sites column provides the location or terminal where the activity occurred (for example, a site name or identifier like "Site 101"). Each row reports data for that specific site.
Device
The Device column provides the terminal for the summarized data.
Date
The Date column provides the calendar date on which the sales/activity was recorded, shown in a standard date format (for example, MM/DD/YYYY).
Wash/Account
The Wash/Account column provides the wash package name or account type associated with the row (for example, Good, Better, Best). This identifies the product or account used for the activations shown.
Total Sales
The Total Sales column provides the total dollar value of sales for the listed wash or account on that site/date (currency sum of transactions for the row).
Sales (%)
The Sales (%) column provides the row’s share of overall report revenue, expressed as a percentage (row Total Sales ÷ report Total Sales × 100), useful for comparing contribution to total sales.
QTY Sold
The QTY Sold column provides the number of units or transactions sold/activated for the wash/account during the reporting period for that site/date (absolute count).
QTY Sold (%)
The QTY Sold (%) column provides the row’s portion of total units sold, expressed as a percentage (row QTY Sold ÷ total QTY Sold × 100), useful for seeing relative volume.
Avg Sale
The Avg Sale column provides the average sale amount per transaction for the row (typically calculated as Total Sales ÷ QTY Sold). Shows typical revenue per activation; displays $0.00 when no transactions occurred.
Total Cars Washed
The Total Cars Washed column provides the total number of vehicles washed under that wash/account for the row. This count may match QTY Sold when one activation equals one car, or differ if activations and cars washed are tracked separately.